Why is cost data used as a guide and a reference whereas market data is used only as a reference? The answer is the difference in detail and reliability. One can imagine the implications of a valve company cutting back on detailed cost analysis and relying just on total costs for guidance. This article will discuss the process of using a niche-by-niche route to achieve 30% earnings before interest, taxes, depreciation, and appreciation (EBITDA).
By Bob McIlvaine, President & Founder – The McIlvaine Company
Truism: Cost data is used as a reference and a guide; market data is used as a reference and an expert is used as a guide.
To qualify this truism, one may argue that it is possible to obtain precise cost data, while the same is not true for markets. The counterargument is then, however, why do individuals use practices such as last-in, first-out (LIFO) and how are good estimates of future costs derived by analyzing trends for materials used? The labor for every product is carefully tabulated. But how detailed are the sales cost tabulations applied to each product in each industry, in each location?
Focus on Niches
A few valve companies are achieving 30% EBITDA but the average for the industry is closer to 15%. The reason for the lower margin is that most companies are not pursuing the best customers with the best products in the best manner. For example, Velan, who was just acquired by Flowserve, is a technical leader in the valve industry and yet has a low EBITDA record.
The road to success is to identify the best niches and focus on them. It is nice to be a general technology leader, but it is much better to be a technology leader in the most profitable niches.
Valve Niches
The $130 billion valve market1 consists of 13,000 niches and 130,000 sub niches which, like LEGO blocks, can be combined into millions of shapes by their creators. The shapes consist of various combinations of products, applications, and geographies.
There are a dozen types of valves with endless variations, such as isolation, control, or protection. There are some 20 main application segments with hundreds of important sub-classes and the world can be divided into 72 countries and 8 small country aggregates. In most cases, a niche involves just one state or region.
To adequately select the best products for the best applications to pursue them in the best manner, large amounts of market data are needed.
Simultaneous Top-Down and Bottom-Up Market Analyses
There should be simultaneous top-down and bottom-up market analysis efforts.
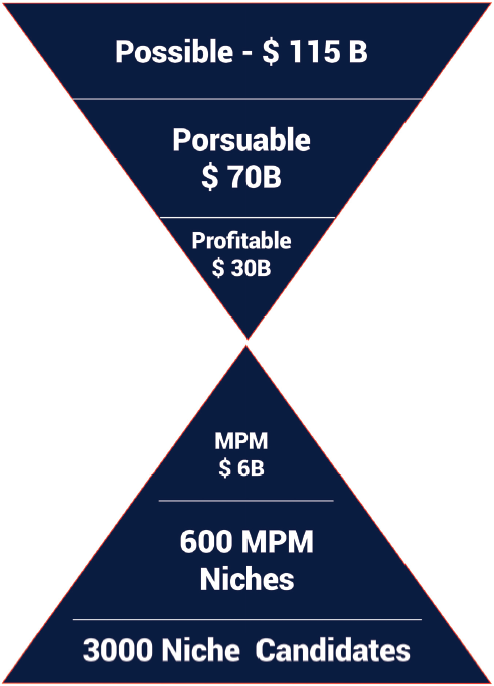
The top-down approach is critical to assess long-term major trends and opportunities. It is also a way to assess the strengths of competitors. The bottom-up approach should be continuous and include each sub-niche of importance. The goal is to focus on niches where a 20% market share and 30% EBITDA can be achieved. The Most Profitable Market (MPM) is an aggregation of these niches.
For example, if one considers an industrial valve company with revenues of USD $500 million that focuses on industrial markets. A top-down approach indicates a potentially profitable market of USD $30 billion/yr. The bottom-up approach concludes that the company could capture 20% of a USD $6 billion market and raise revenues to USD $1.2 billion. If it wants to grow at 10% per year it will need to identify and pursue 25 new niches per year.
The McIlvaine Industrial Valve report details a USD $80 billion market. However, it does not include most of the valves used in discrete applications such as the lubrication of a machine tool, and does not include commercial applications. When these applications are included, the market is USD $130 billion/yr. This is also known as the Total Available Market (TAM).

Further analysis using McIlvaine-focused reports such as Valves for Hydrogen shows that only USD $70 billion is pursuable given the structure and assets of the corporation. This is the Serviceable Available Market (SAM).

Further Analysis
A more detailed study using other McIlvaine data shows that a market of USD $30 billion could be potentially profitable. This is the Serviceable Obtainable Market (SOM).
This top-down study is necessary to define the boundaries for the bottom-up forecast. However, it would be a mistake to use this data directly for decision-making. The reason is that the market is an aggregation of niches. Decisions should be made on aggregation which only comes with a bottoms-up study.
The Bottom-up initiative quantifies each $1 million sub-niche and aggregates them in the most profitable niches of USD $10 million. In this case, it is determined that sales can reach USD $1.2 billion by capturing 20% of a $6 billion/yr. market.
If the company wants to grow at 10% per year it will have to add 25 new niches per year. Considerable effort is needed to select just a small percentage of the niches. It is made more complex by the need to consider new niches as well as existing ones.
The sales and management structure should be based on a niche analysis of USD $10 million/yr. markets. The facts and factors to be assessed include the technology and ratings for competitor products. These findings are then incorporated into a value proposition. So, for a USD $500 million company, there needs to be at least 250 value propositions. The bottom-up analysis uses the existing niche forecasts and value propositions as the starting point. To grow at 10% per year it will need 25 new value propositions per year.
Final Thoughts
The bottom-up focus should be on the existing operations whereas the top-down focus should be on new opportunities where there are promising most profitable market opportunities.


