Fossil fuels will continue to be critical for modern economies for the foreseeable future. In its latest Energy Outlook, the U.S. Energy Information Administration (EIA) stated that petroleum and natural gas will continue to be the most-consumed energy sources in the United States until 2050. Of all fossil fuels, natural gas is the cleanest; that is, it is the one that generates the least amount of greenhouse gas emissions when burned. As it is the cleanest, many believe that its participation in the energy mix should increase in the coming years. The United States is the largest gas producer in the world, but its existing LNG infrastructure is hampering exports. This article explores what is happening in the gas markets, with a focus on LNG in the United States and the new projects that are planned to help it improve trade.
By Davi Sampaio Correia, Technical Consultant
Natural Gas Markets
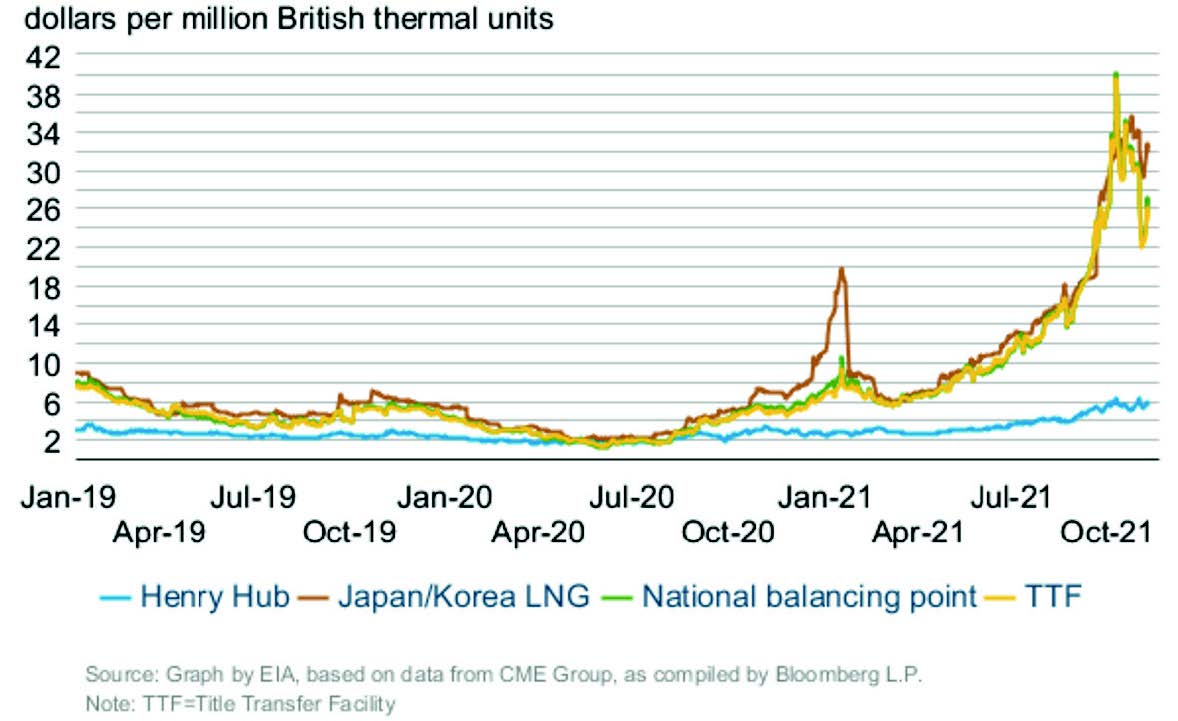
The slow rebound of the global economy from the COVID-19 pandemic has created some supply shocks along the way. During 2021, there have been many signs of putting the foot back on the accelerator after a long pause – lack of trucks; lack of containers; lack of drivers; and an abundance of high costs. In the energy markets, the technical term for what happened to global gas prices is ‘insane’ (see Figure 1).
Thanks to its large reserves, gas prices in the United States increased, but kept the worst effects at bay. Before the pandemic (February 2019), gas was being negotiated at the Henry Hub for 2.69 dollars per million Btu.1 In November 2021, the same gas was being negotiated for 5.05 dollars per million Btu, a 87% increase. That may look excessive, but when compared to the situation in Europe, it seems small as gas surged from to 6.01 to 31.05 dollars per million Btu in roughly the same period.2
Those prices are expected to fall after winter, but Europe an Asia will continue to need large quantities of gas to fuel their economies and there is only one way to get American gas to overseas customers: LNG.
Overview of the United States LNG infrastructure
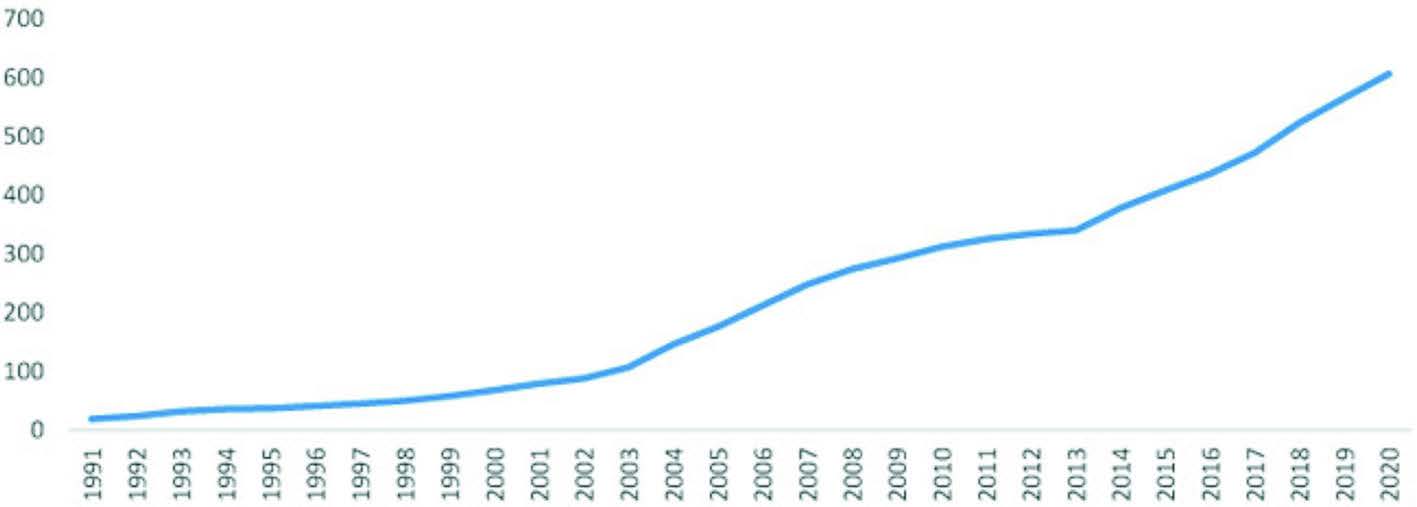
Long before there were LNG carriers crisscrossing the oceans, there were LNG plants in the United States. The first prototype plant started operation in 1917 in West Virginia and the first commercial liquefaction facility was built in Cleveland, Ohio, in 1941. “The first transportation of a large bulk of LNG across the ocean occurred in 1959, in which LNG was carried by an ocean-going vessel (known as the Methane Pioneer) from Lake Charles, Louisiana, to Canvey Island, United Kingdom.”3 Since the days of the Methane Pioneer maiden trip, the global LNG carrier fleet has steadily increased, largely over the last decades (See Figure 2). Presently, there are over 600 vessels, and this number will likely increase by 142 until 2025.4
LNG require facilities for liquefaction and regasification. To account for this, the U.S. has more than 110 plants5 that perform four types of service. They facilities can be involved in a range of activities including export or imports, supplying natural gas to the interstate pipeline system or local distribution companies, producing LNG for vehicle fuel or for industrial use, and storing natural gas for periods of peak demand, known as ‘peak shaving’.
Peak shaving is “when LNG is stored at a power plant so that in times of peak demand the utility can tap into the LNG in order to increase power output to meet demand spikes. This most often occurs during the winter and summer months when abnormally cold or hot temperatures cause spikes in electricity demand.”6
United States LNG infrastructure
Gas is, and will continue to be, a hot commodity. In 2013, LNG held a 30% share of the total global trade in natural gas. According to the 2021 edition of the BP Statistical Review of World Energy,7 LNG trade amounted to 487.9 billion cubic meters, while inter-regional pipeline trade amounted to 452.2 billion cubic meters. These numbers imply that LNG is now responsible for more than 50% of the global trade. To keep up with demand, the United States need to improve their infrastructure.
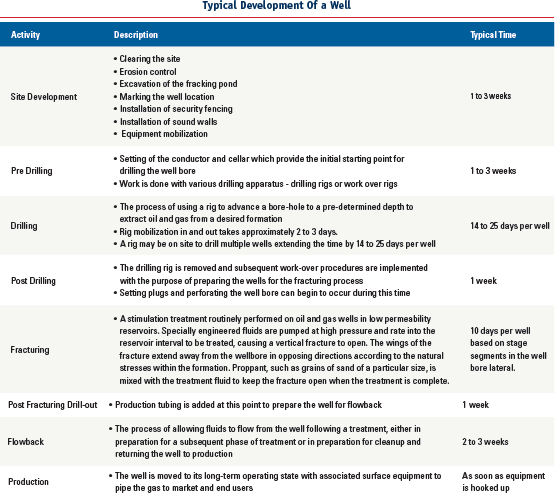
Natural gas in the U.S. comes mostly from three regions: the Appalachian Basin in Ohio, Pennsylvania and West Virginia, the Permian Basin in Texas and New Mexico, and the Haynesville Shale in Texas and Louisiana. Drilling a well in the shale patch does not take a long time. It can be done in as little as four months (See Table 1). The problem is that most of the profits come in the first six months of production, so producers want to time their drilling with optimum gas prices and an adequate infrastructure to deliver it to consumers. That means pipelines and LNG liquefaction facilities.
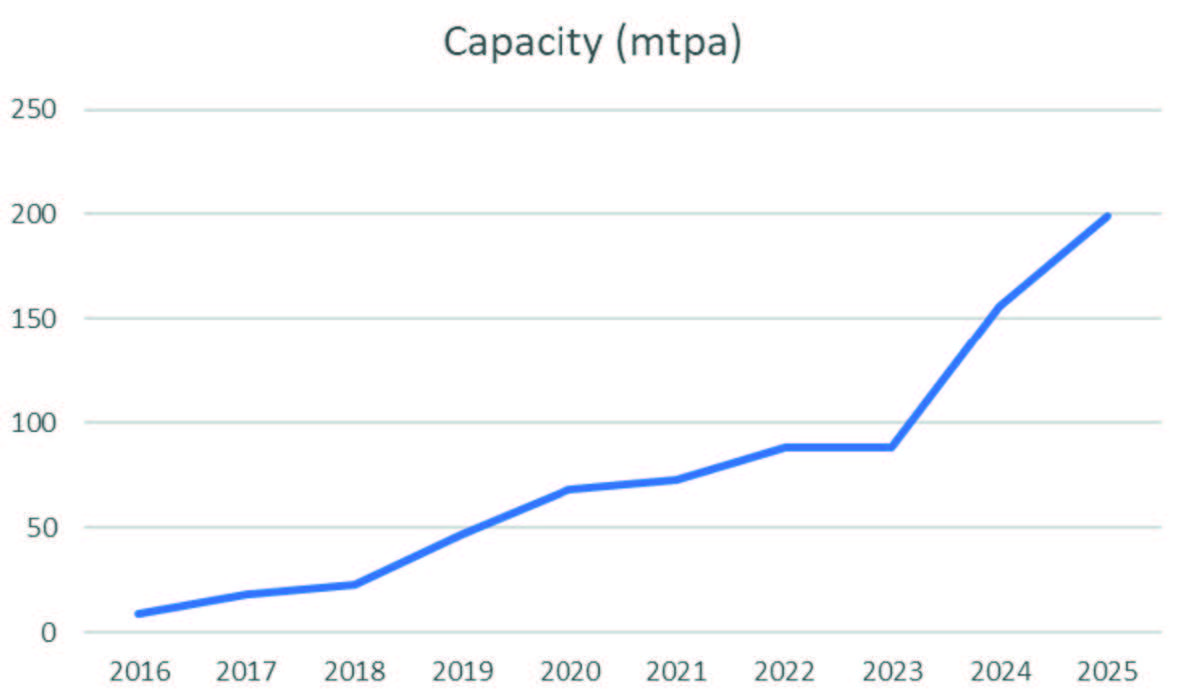
While there are 21 countries with liquefaction facilities, 50% of the total production is produced by Australia (19.5%), Qatar (17.1%), and the United States (14.9%). This ratio is expected to change drastically until 2025. Expansion of existing plants and construction of new plants should catapult the U.S. liquefaction capacity from 68 to 199 million tons per annum (mtpa), as seen in Figure 3. That expansion should make the U.S. achieve a 26% share of the global capacity and be the largest producer.
Figure 4 highlights the revolution in LNG exports since horizontal drilling and hydraulic fracturing unleashed the potential of the shale gas reserves.
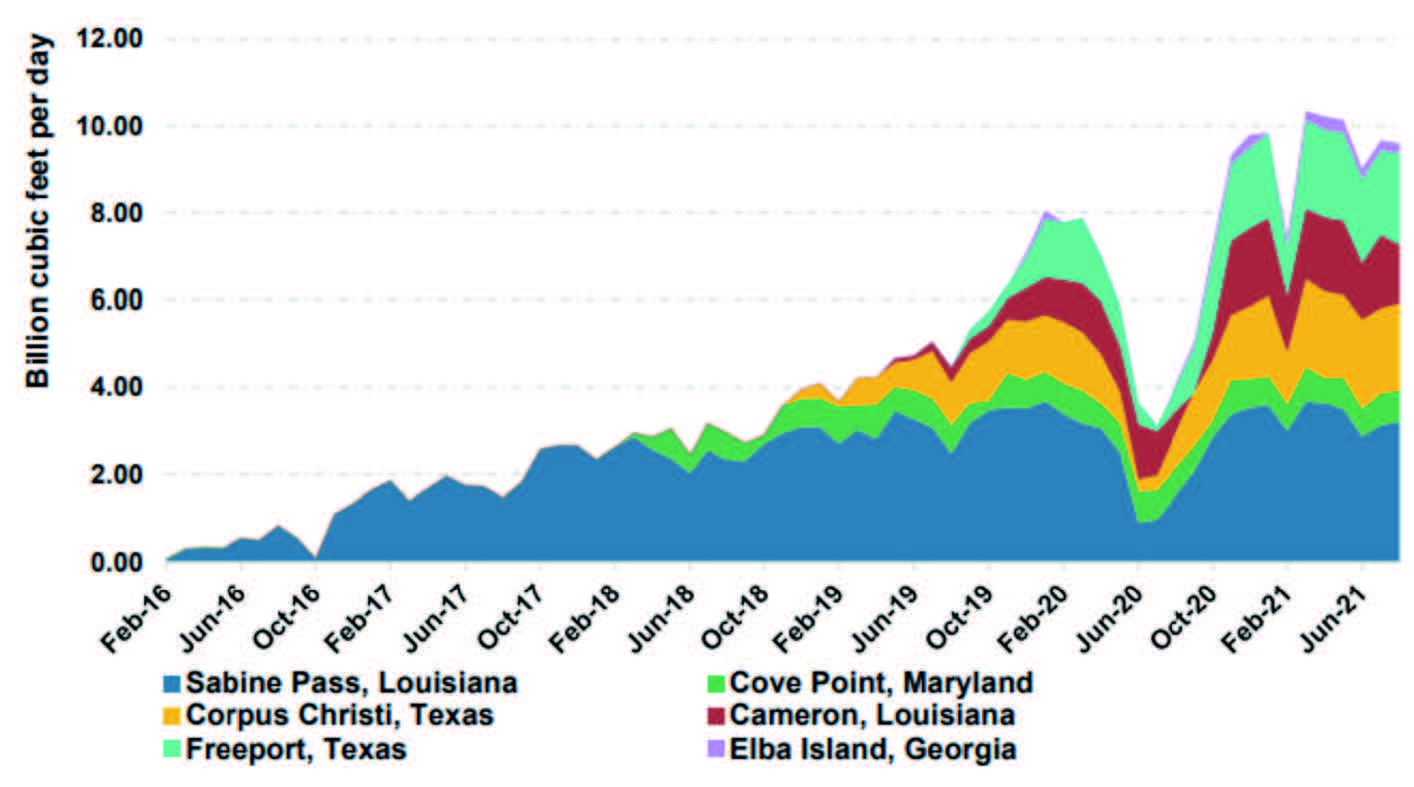
Today, the United States exports LNG through six major terminals: Sabine Pass (LA), Corpus Christi (TX), Freeport (TX), Cove Point (MD), Cameron (LA), and Elba Island (GA). Figure 5 presents the volumes exported from February 2016 to September 2021. The progressive trend suggests that the worst of the economical impact of the COVID-19 pandemic is over and the world economy is rebounding.
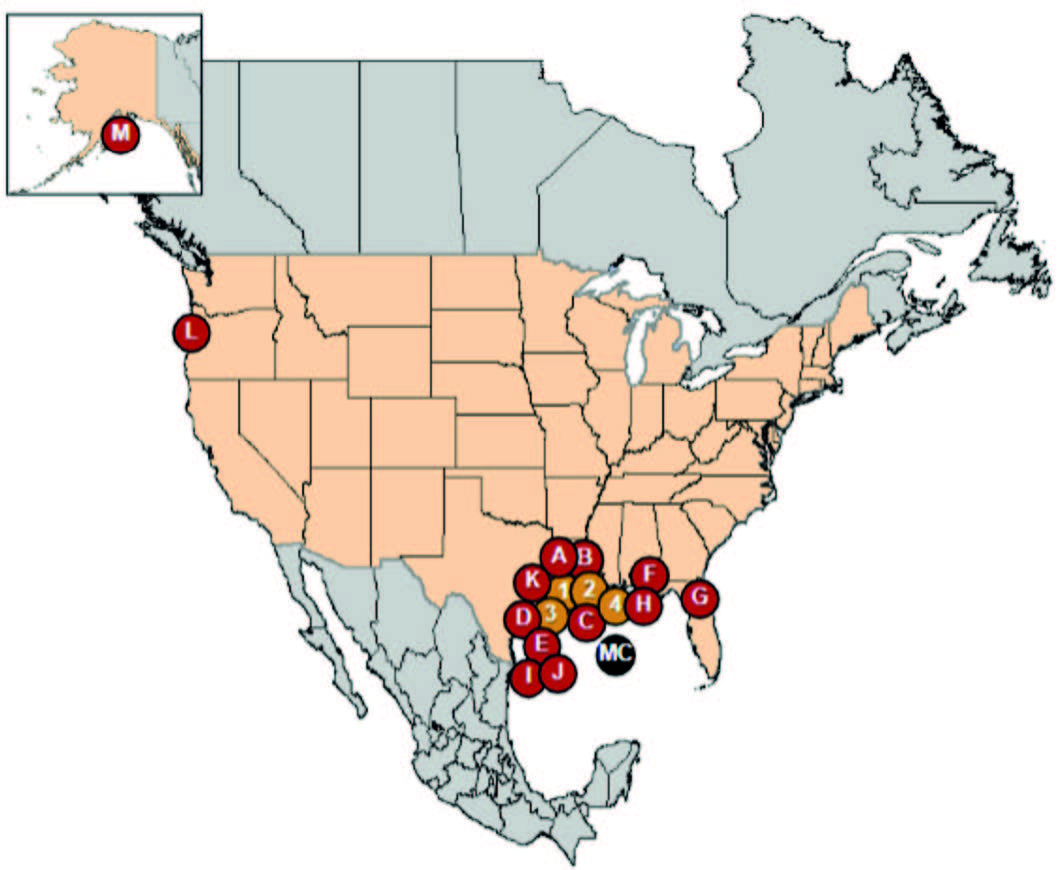
Construction or expansion of LNG export terminals require the approval of some government agencies, including the Federal Energy Regulatory Commission (FERC) and the U.S. Maritime Administration (MARAD). The following is a list of the upcoming projects for the next years. Figure 6 shows their location.

FERC – APPROVED, UNDER CONSTRUCTION
1. Sabine Pass, LA: 0.7 Bcfd (Sabine Pass Liquefaction Train 6 ) (CP13-552)
2. Cameron Parish, LA: 1.41 Bcfd (Venture Global Calcasieu Pass) (CP15-550)
3. Sabine Pass, TX: 2.26 Bcfd (ExxonMobil – Golden Pass) (CP14-517, CP20-459)
4. Calcasieu Parish, LA: 4.0 Bcfd (Drift-wood LNG) (CP17-117)
FERC – APPROVED, NOT UNDER CONSTRUCTION
A. Lake Charles, LA: 2.2 Bcfd (Lake Charles LNG) (CP14-120)
B. Lake Charles, LA: 1.186 Bcfd (Magnolia LNG) (CP14-347)
C. Hackberry, LA: 1.41 Bcfd (Sempra -Cameron LNG Trains 4 & 5) (CP15-560)
D. Port Arthur, TX: 1.86 Bcfd (Port Arthur LNG Trains 1 & 2) (CP17-20)
E. Freeport, TX: 0.72 Bcfd (Freeport LNG Dev Train 4) (CP17-470)
F. Pascagoula, MS: 1.5 Bcfd (Gulf LNG Liquefaction) (CP15-521)
G. Jacksonville, FL: 0.132 Bcfd (Eagle LNG Partners) (CP17-41)
H. Plaquemines Parish, LA: 3.40 Bcfd (Venture Global LNG) (CP17-66)
I. Brownsville, TX: 0.55 Bcfd (Texas LNG Brownsville) (CP16-116)
J. Brownsville, TX: 3.6 Bcfd (Rio Grande LNG –NextDecade) (CP16-454)
K. Corpus Christi, TX: 1.86 Bcfd (Cheniere Corpus Christi LNG) (CP18-512)
L. Coos Bay, OR:1.08 Bcfd (Jordan Cove)(CP17-494)
M. Nikiski, AK: 2.63 Bcfd (Alaska Gasline)(CP17-178)
MARAD– APPROVED, NOT UNDER CONSTRUCTION
MC. Gulf of Mexico: 1.8 Bcfd (DelfinLNG)
REFERENCES
1. https://www.eia.gov/dnav/ng/hist/rngwhhdm.htm
2. https://ycharts.com/indicators/europe_natural_gas_price
3. Lees’ Loss Prevention in the Process Industries (Fourth Edition), Volume 2, Elsevier, 2012
4. https://energynorthern.com/2021/07/16/new-trends-on-the-global-market-of-lng-carriers/
5. https://www.ferc.gov/natural-gas/lng
6. https://adi-analytics.com/2015/06/03/a-new-role-for-small-scale-and-peak-shaving-lng-infrastructure/
7. BP Statistical Review of World Energy, 2021, 70th edition, available at https://www.bp.com/content/dam/bp/business-sites/en/global/corporate/pdfs/energy-economics/statistical-review/bp-stats-review-2021-full-report.pdf
8. https://www.eia.gov/energyexplained/natural-gas/liquefied-natural-gas.php
9. https://www.energy.gov/sites/default/files/2021-11/LNG%20Monthly%20September%202021_0.pdf
10. https://cms.ferc.gov/media/north-american-lng-export-terminals-existing-approved-not-yet-built-and-proposed-2

