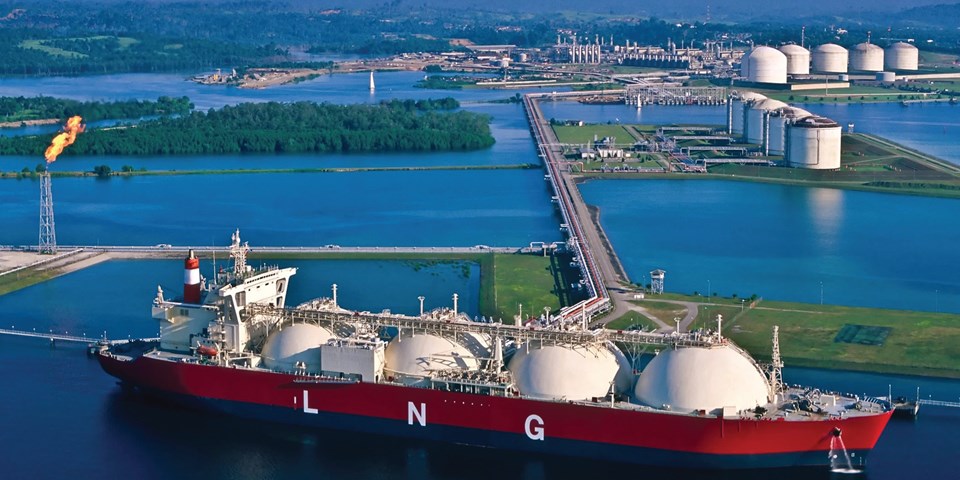
Fast-forward fifty years and the world is very different; now, natural gas is often liquefied and exported to distant consumers. Today, Liquefied Natural Gas – or LNG – is a critical part of the downstream segment and it comprises of a significant share of the energy matrix in many countries. It is therefore important to be familiar with the LNG industry and its present market conditions.
By KCI Editorial.
Transporting LNG
Liquefied Natural Gas (LNG) is natural gas made liquid. The primary method of transporting gas over a long distance is to use a pipeline. There are several factors however, that can impede this method: technical, political, or economical. When gas cannot be transported, utilizing LNG becomes the obvious choice. In a nutshell, the LNG industry focuses on liquefying natural gas at cryogenic temperatures to reduce volume, so that it can be shipped in dedicated vessels; it is then regasified at the destination. Once back in the gaseous state, it is injected into the pipeline network of gas distribution, and mingles with gas from other origins.1
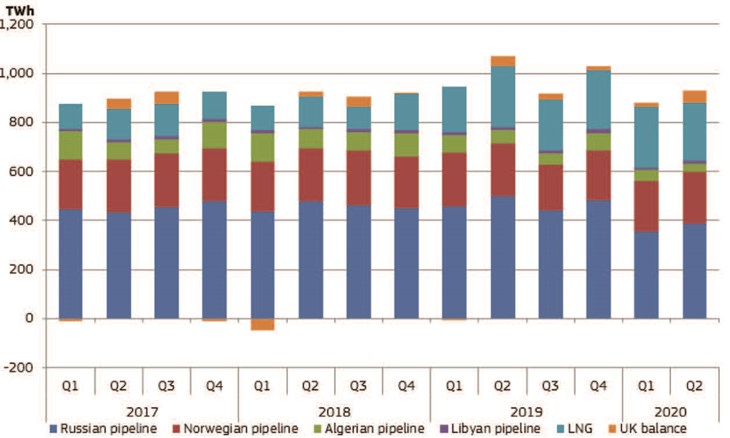
It might seem strange at first, but even countries served by gas pipelines rely on LNG imports. Take Europe, for example. Figure 1 shows the EU imports of gas in the 2017-2020 period, both by pipelines and LNG.2 You can see that LNG terminals were responsible for around 25% of the gas that entered the EU.
One of the reasons the EU invest in LNG terminals is energy security. Although there is no standardized definition of energy security, the main idea is to make a country or region more robust to energy disruption by diversifying its primary energy supplies. The more energy-dependent a society is, the more it should be worried about energy security. In the case of the EU, LNG serves this purpose well, as it can be readily integrated in the existing gas network.
Another reason why countries like to invest in LNG capabilities, can be best described by looking at the United States’ ‘peakshaving’ process, as an example. “Peakshaving is a way local electric power and gas companies store gas for peak demand that cannot be met via their typical pipeline source. This can occur during the winter heating season when cold fronts move through, or when more natural gas is needed to generate electric power for air conditioning in the summer months. The utility companies liquefy pipeline gas when it is abundant and available at off-peak prices, or they purchase LNG from import terminals supplied from overseas liquefaction facilities. When gas demand increases, the stored LNG is converted from its liquefied state back to its gaseous state, to supplement the utility’s pipeline supplies.”3
The LNG Supply Chain
The LNG supply chain is generally described as having four components: (1) Exploration and Production, (2) Liquefaction, (3) Shipping, and (4) Regasification (which comprises storage and distribution). Figure 2 shows how these components fit into the gas midstream segment. Although interlinked, they are operated by different agents in an independent manner. “To attract investors to an LNG project, the price of a unit volume of gas delivered into a pipeline must at least equal the combined costs of producing, liquefying, transporting, storing, and vaporizing the gas, plus the costs of the capital needed to build necessary infrastructure—and a reasonable return to investors. The largest component of the total cost of the LNG value chain is usually the liquefaction plant, while the production, shipping, and re-gasification components account for nearly equal portions of the remainder.”1“Exploration activities involve seismic measurements, drilling, and well completions. Once the well is successfully completed, the natural gas produced from reservoirs is transported from the wellhead to a processing facility via high-pressure pipelines.”4 Over the last 20 years, advances in drilling and recovery technology – specifically, horizontal drilling and hydraulic fracturing – have transformed the energy market. The United States is now the largest producer of natural gas in the world, thanks to the exploration of its vast shale formations.

Liquefication Process The availability of LNG has also provoked changes in the energy consumption matrix. For example, the better availability of gas, coupled with environmental considerations and advances in combined-cycle gas turbine (CCGT) technology, have made gas the major source for power generation in the United States, responsible for around 40% of the total energy output.5 It is worth mentioning that natural gas is the cleanest burning fossil fuel; it produces less emissions and pollutants than either coal or oil.
A liquefaction plant is responsible for removing impurities from the incoming gas and cooling the remaining fluid to a liquid state at atmospheric pressure; temperatures in this state are in the cryogenic range, around −162°C (-260°F). The plants are normally composed of trains – parallel processing units – treating and liquefying gas simultaneously. This allows a given train to be shut down for maintenance, while production continues via another. “The liquefaction process equipment consists of compressors driven by steam or gas turbines and heat exchangers, where heat from the incoming gas is transferred to refrigerant gases (e.g., propane, ethylene, or mixtures thereof), which in turn transfer heat to an outside coolant, which can be air or water or a combination of both.”1
Once liquefied, the LNG is stored in tanks at atmospheric pressure. The tanks are double-walled; an inner wall – made of cryogenic materials – that stays in contact with the LNG; and an outer wall, which is generally made of carbon steel or reinforced concrete. Between the two walls, several feet of insulation material are inserted.
Tankers
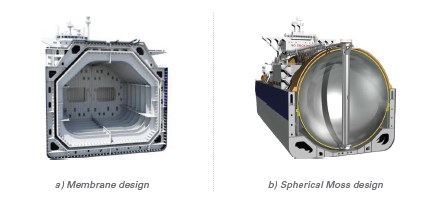
From the storage tanks, the LNG is loaded into LNG tankers. These are specially designed vessels, built in similar fashion as the tanks, with double hulls for technical and safety reasons. Two of the most common designs for these ships are (1) the spherical (Moss) design and (2) the membrane design, which can be seen in Figure 3. A general rule of thumb for comparing transportation costs between LNG tankers and pipelines, states that, “liquefying natural gas and shipping it becomes cheaper than transporting natural gas in offshore pipelines for distances of more than 700 miles, or in onshore pipelines, for distances greater than 2,200 miles.”4
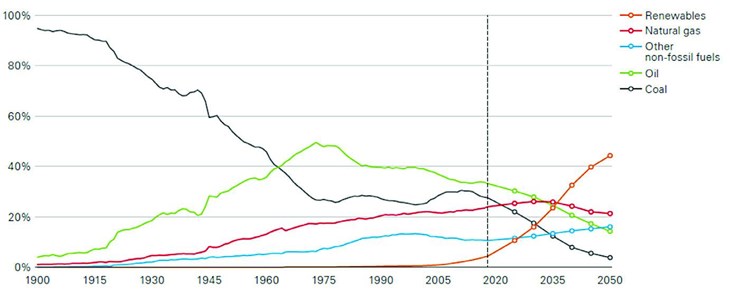
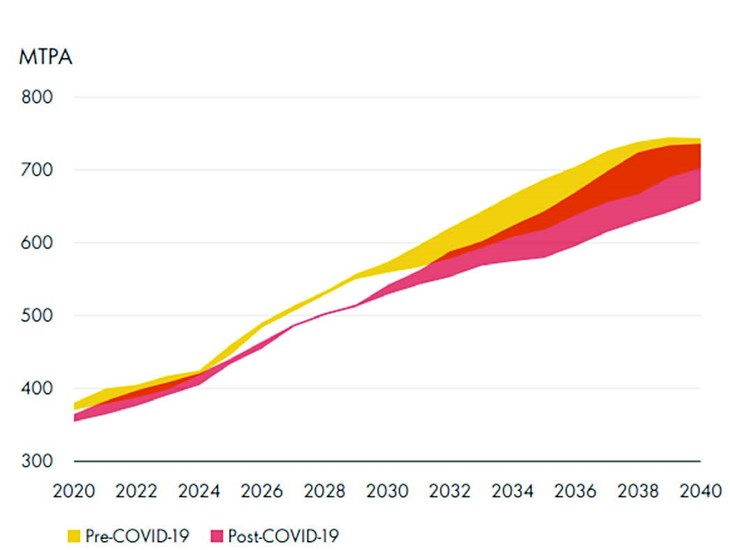
As has been explained, natural gas is a critical component in the energy matrix of the largest economies of the planet; it is also a fundamental piece in a transition to a lower carbon energy system. More and more, natural gas is replacing other high-emissions fossil fuels in many applications, such as coal (for power generation). Another example is maritime fuels; there are now LNG-powered ships and even bunkering ships (ships that transfer LNG to other ships for use as fuel). However, gas use will not grow indefinitely in the long-term, due to a rise in the renewables’ share of the energy mix. According to reference 6, natural gas may peak around 2030-2037 at 23% of the global energy mix (see Figure 4). In 2020, global demand for LNG increased to 360 million tons.7 Such increase is not consistent with past years growing rates, but this can be explained by losses in global GDP due to the COVID-19 outbreak. India and China should continue to rely on LNG imports to fuel their economies; the latter also announced a “target to become carbon neutral by 2060 is expected to continue driving up its LNG demand through the key role gas can play in decarbonizing hard-to-abate sectors.”7 Based on this trends, global LNG demand is expected to reach 700 million tons by 2040 (see Figure 5).
[1] Liquefied Natural Gas: Understanding the Basic Facts, report prepared by the U.S. Department of Energy (DOE) in collaboration with the National Association of Regulatory Utility Commissioners (NARUC), available at https://www.energy.gov/sites/prod/files/2013/04/f0/LNG_primerupd.pdf#:~:text=The%20 exact%20composition%20of%20natural%20gas%20%28and%20 the,liquid%20by%20cooling%20it%20to%20about%20
-260%C2%B0F%20%28-162%C2%B0C%29.
[2] Quarterly Report Energy on European Gas Markets with special focus on the role of hydrogen in the future EU energy mix Market Observatory for Energy DG Energy, Volume 13 (issue 2, second quarter of 2020), https://ec.europa.eu/energy/sites/default/files/documents/quarterly_report_on_european_gas_ markets_q2_2020.pdf
[3] Michael D. Tusiani & Gordon Shearer, LNG : a nontechnical guide, PennWell Corporation, ISBN 978-0-87814-885-1, 2007.
[4] Michelle, M.F., Introduction to LNG. An overview on liquefied natural gas (LNG), its properties, the LNG industry, and safety considerations ed. 2012, Houston, Texas: Centre for Energy Economics, Bureau of Economic Geology.
[5] https://www.eia.gov/tools/faqs/faq.php?id=427&t=3
[6] BP, Energy outlook 2020 report, available at https://
www.bp.com/content/dam/bp/business-sites/en/global/corporate/pdfs/energy-economics/energy-outlook/bp-energy-outlook-2020.pdf
[7] https://www.shell.com/energy-and-innovation/natural-gas/liquefied-natural-gas-lng/lng-outlook-2021.html#iframe=L3dlYmFw cHMvTE5HX091dGxvb2svMjAyMS8
[8] https://www.oxfordenergy.org/wpcms/wp-content/uploads/2018/02/The-LNG-Shipping-Forecast-costs-rebounding-outlook-uncertain-Insight-27.pdf


