Computational fluid dynamics (CFD) is a methodology of simulating fluid flow under given conditions to model and predict its behavior. It is used across a variety of industries ranging from aeronautics and meteorology to biomedical engineering and battery design. In the valve industry, it can be used to evaluate process conditions’ effects on installed valves or predict a valve’s suitability for the customer’s installation. One of the most common uses in the valve industry, though, is to evaluate a valve’s flow coefficient – or CV.
By Justin Bernard, Ball Valve Engineer, Daniel McConnell, R&D Lab Test Engineer, Allen Portillo, R&D Lab Technician, and Kishorekumar Vijayaram, Ball Valve Engineering Manager – Bray International
A simulation, as with any other calculation, requires a myriad of assumptions to be made in order to reach a solution of any kind. To achieve a reasonable solution, one must make reasonable assumptions. Due to this necessity, validation testing is required for simulated values as much as it is required for any other calculated value such as torque or yield strength.
Generally, the process of simulation begins with development of requirements, proceeds with simulation, followed by results evaluation, and ending in validation. For the sake of experimentation, it was decided to collect physical test data on actual flow tests and use these values in the development of a CFD model to then be used for designing valves with specific target CV values. These simulations would once again be validated in the same conditions that the initial data was recorded to verify the simulation’s accuracy.
Creating a Data-Based Model
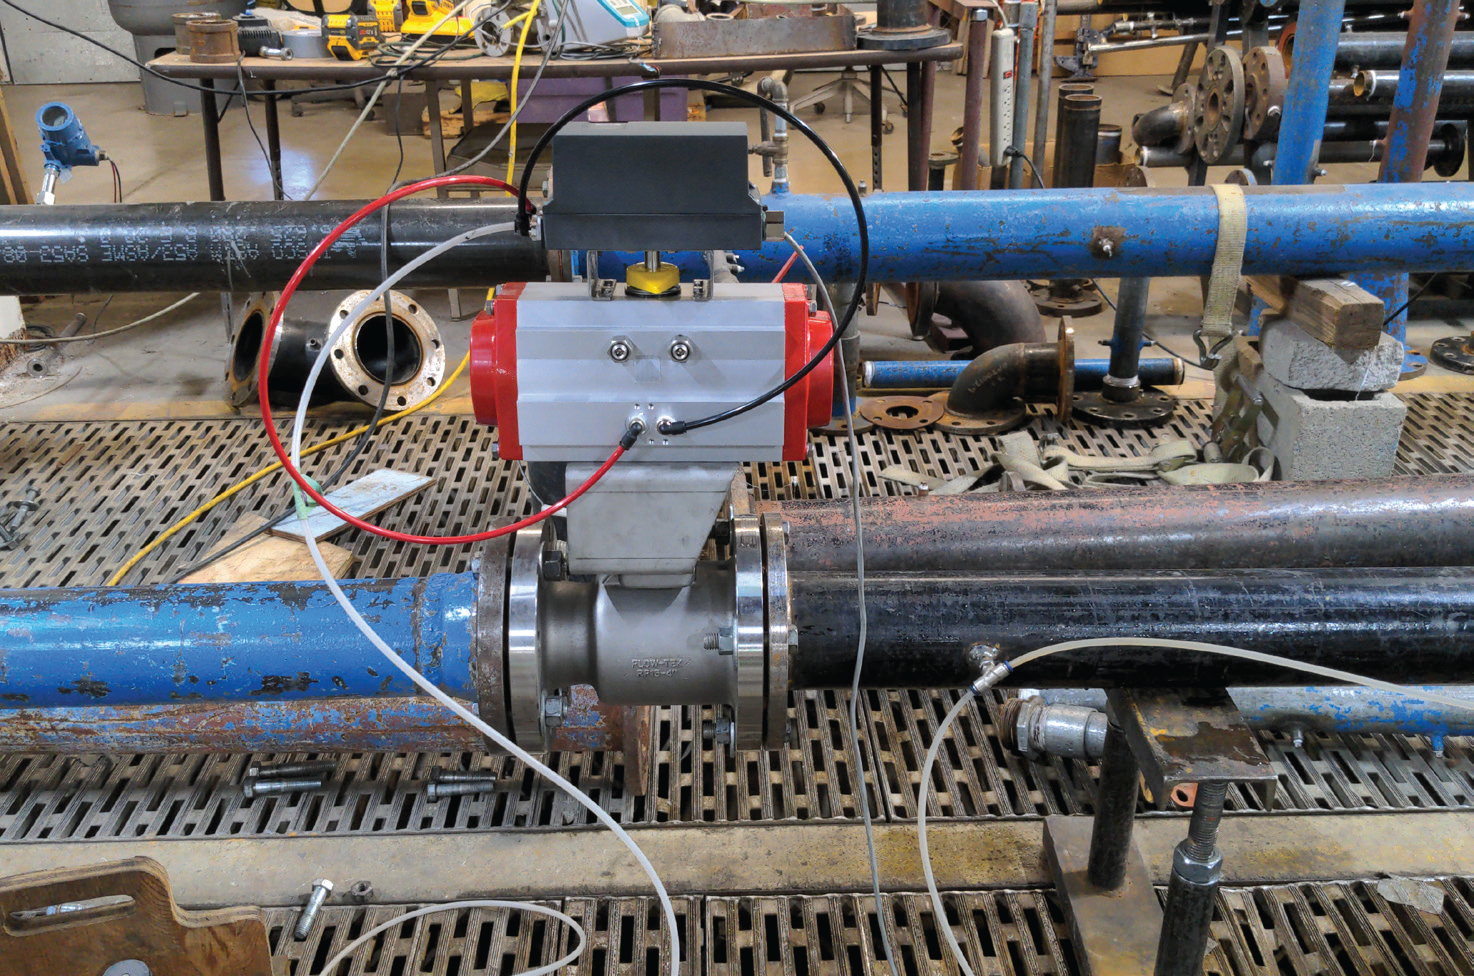
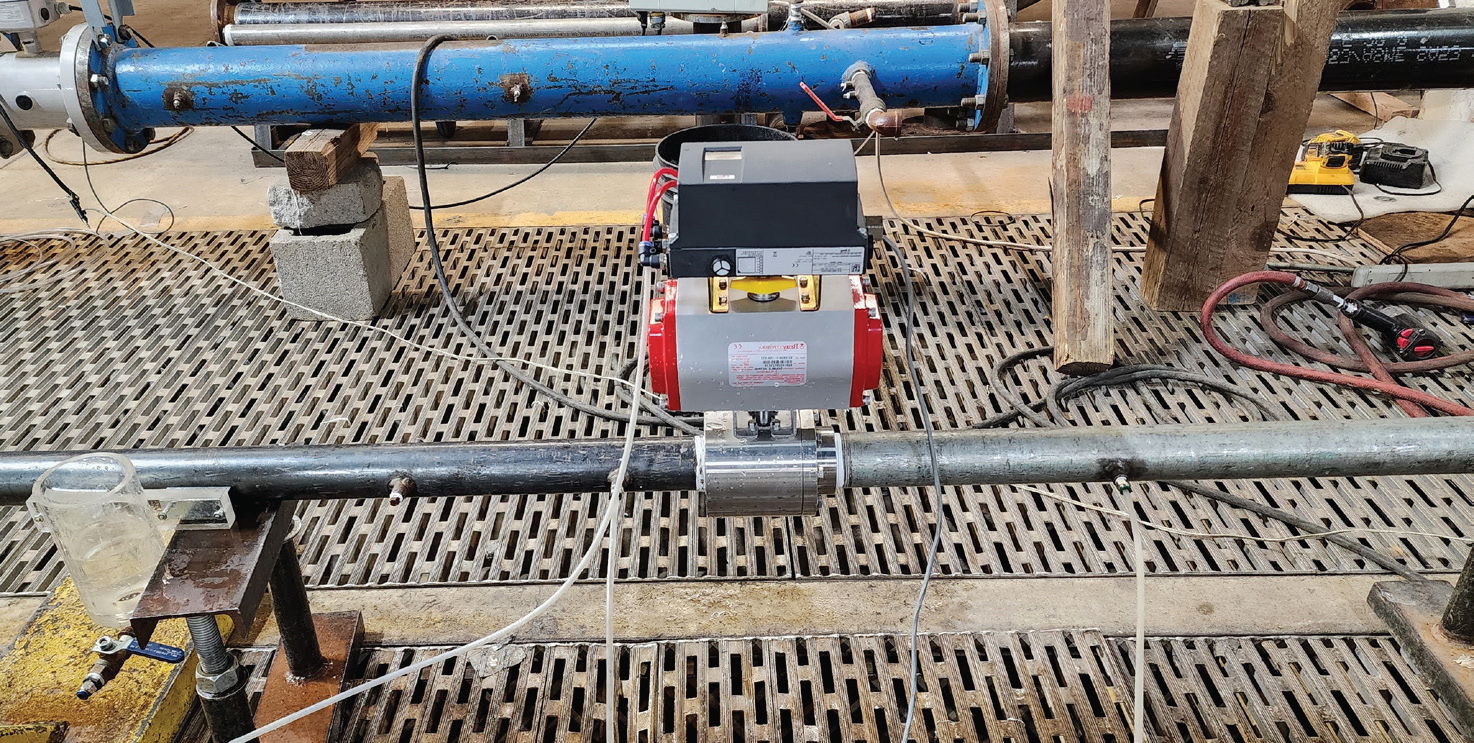
To create the model, a series of flow tests following ANSI/ISA-75.02.01-2008 were performed at the Utah Water Research Laboratory in Logan, UT on standard port floating ball valves. With this design, a Venturi effect will naturally occur due to the reduction in flow area in the reduced bore and expansion back to the nominal pipe diameter at the flange.
Four sizes were tested in 10-degree increments utilizing double-acting actuators and smart positioners to aid in setting the valve positions for each test. The test reports included information such as tested pressure differentials and flow rates for each tested position; water properties such as estimated density and kinematic viscosity were provided for each valve test setup as well.
Utilizing simplified CAD models of each valve to reduce meshing and simulation time, iterative simulations were run on each size tested in the Utah lab. After testing several different turbulence models and simplifications, the most accurate in the full-open condition was decided to be the k-epsilon turbulence model. Full open CV values calculated this way fell within 4% of the tested CV for valves up to 4” and 7% for the 6” valve.


After creating a baseline model for larger sizes, more refinement was necessary for valves smaller than 2”. For these sizes, surface roughness plays an especially important role in simulation and testing. When analyzing the effect on larger sizes, reasonable surface roughness variations were not observed to significantly impact the simulated CV.
A similar series of flow tests were performed on ½” valves in Nagman Calibration Services’ facility in Chennai, India. Upon refinement of surface roughness values and utilizing every other boundary condition derived from the Utah flow tests, a value of pipe and valve surface roughness was determined once the simulated CV was consistently within 4% of the lab-tested results. These values were then added to the boundary conditions within the Utah test valves for verification; results changed by less than 1%.
The primary purpose of creating the databased model was to design characterization profiles for rotary control valves. Utilizing the simulation model that was developed, these profiles were incrementally iterated upon until the target flow characteristics were achieved. CV values were calculated using this simulation at every ten-degree increment from the fully open to the fully closed positions.


Validating Design Simulations
After achieving simulation results that met design requirements, test components were 3D printed for prototyping and tested in the Utah lab under the same conditions to which the standard port valves were subjected. For all tested components, aside from very restricted flows in the full open position due to low CV targets, tested CV values fell within 5-11% of simulated values with an average error of less than 6%. More refinement was required for the more restricted flows, and very fine meshes yielded values more in line with future testing.
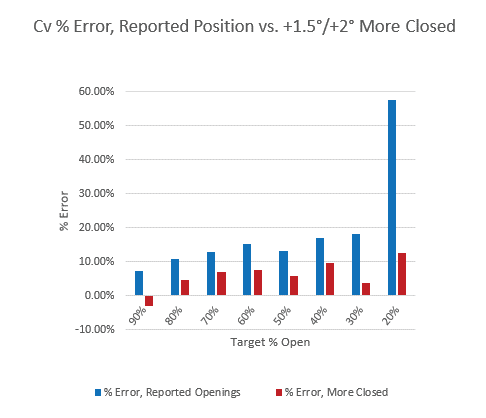
The largest deviation between the calculated CV values and the tested values arose in the positions between fully open and fully closed. These deviations were noted in the initial testing with the larger standard port valves, but proved to be a recurring error in this validation test.
Upon evaluation of these intermediary positions in both physical and simulated models, it was determined to examine the exact position of the obturator.


Analyzing Obturator Position Error
Inherent to any mating components, there is a designed ‘fit’ – and within this fit is a designed gap for components of differing tolerance levels to be able to conjoin and perform their necessary function. Within a rotary control valve, there are several mating components whose gaps add up to create some hysteresis – a lag in the position of the obturator behind where the driving component believes it to be. When any component is added to the valve, this hysteresis worsens for each connection added. In the case of the testing performed in the Utah lab, a coupler, actuator, and positioner were all added atop the valve. Both the actuator and positioner have internally mating components as well, which also contribute to the observed lag.
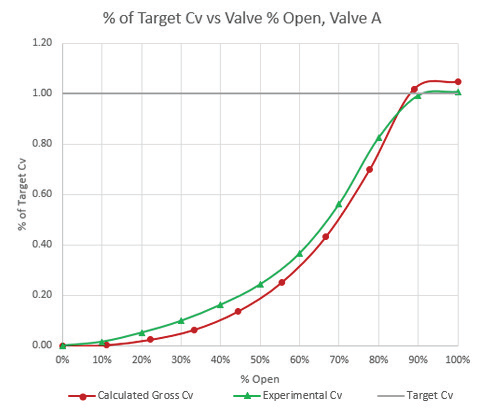
Upon analyzing the potential for error within the data-based simulation model, it was determined that this error indicated a theoretical difference of 1.5-2 degrees between the reported valve position and the actual position of the obturator based on the achieved CV. When the tests performed with the prototype designs were analyzed, an error of up to 10.5 degrees was seen. This correlation is easily visible when comparing flow coefficient curves measured in testing to simulated curves.
ANSI/ISA-75.11.01-2013, “Inherent Flow Characteristic and Rangeability of Control Valves” requires that any valve tested per ANSI/ISA-75.02.01-2008 must be within a certain percentage of a published CV value at any point along its travel from the fully open to fully closed positions. Section 2.1.3 of ANSI/ISA-75.11.01-2013 states that “the positioning accuracy of the actuator […] should be considered when deriving the installed rangeability for a specific application.” Based on the analysis performed earlier on the error that can be created with inherent hysteresis in test setup, a question arises on how CV testing for the sake of publishing data should be performed.
Should the actuation or positioning setup change without accounting for the true position of the obturator, the recorded CV value may differ drastically from the published value at the specified valve target position due to the change in level of hysteresis of mounted components. In essence, the same valve specimen tested using two different actuation or positioner setups can show different flow characteristics when tested twice. According to ANSI/ISA-75.11.01-2013, this deviation would require a re-evaluation of published valve CV data despite nothing changing about the valve itself.


Using Data-Based Simulations and Position Analysis Moving Forward
Validation is a necessary step in any calculation – and by extension, any simulation. Creating a model based on data should – in theory – streamline the development process as a form of first-round validation. Utilizing this foundation, design calculations were per- formed that were then validated using the same test setup that was used to develop the model. For the most part, the derived values and assumptions proved to be reasonable.
One assumption that was deemed insufficient was that of the true position of the obturator. In a rotary control valve, this is a vital input. Without known, established controls on this value, recorded flow coefficient values may differ beyond even industry-required specification limits. To correct this, testing must be performed to determine the obturator’s position in relation to the positioning target. This test will measure the hysteresis within the valve first and foremost, and the actuator and positioner error in tandem. Based on initial testing utilizing direct reading of valve obturator position as compared to the target position, this difference has been observed to be beyond trivial.
Having a good foundation of the boundary conditions for flow tests has proven to be a valuable methodology for control valve flow characteristic design. However, the assumption that the obturator’s position is correct has proven to be a poor one that requires evaluation for any control valve intended for use beyond the fully opened and fully closed positions.

