Those questions stuck to my mind and I have been researching them from different sources – chiefly among them are the books Energy Transitions by Vaclav Smil and The New Map by Daniel Yergin. What you will read in this article is a condensed version of my findings. My conclusion? The valves for the next energy transition are not yet known. Read on to learn why.
By Davi Sampaio Correia – Technical Consultant
What are Energy Transitions? Why Do They Happen?
Since its dawn, humanity has been using natural resources for survival and comfort. For a long time, plants and animals were the only ‘fuel’ and the human body the only “prime mover”, being a prime mover ‘any device which transforms thermal, kinetic, or chemical energy into useful work.’1 We can say that the history of energy transitions is the history of change in fuels and prime movers throughout our brief stay in this planet.
In terms of fuel, we moved from biomass – the mass of living biological organisms in a given area or ecosystem at a given time2 – to coal to oil to gas. In terms of prime movers, we moved from muscle to wind and water (think of windmills, sails, and water wheels) to steam engines and turbines; and then to internal combustion engines and gas turbines.
What was the drive for these earlier shifts? If you are over 40, you should recognize all three machines in Figure 1. Moving from a manual lawn mower (a) to a gas-powered one (b) required the latter to be invented – that is, technology availability – but also to be conveniently available (machine and fuel) at a reasonable cost. In a nutshell, energy transitions happened in the past when better, more efficient, and convenient technology and fuels became available. Or when a fuel source became depleted or restricted, as in the case of whale oil for illumination or moving from wood to coal due to diminishing forests.
However, the move from (b) to (c) is a bit more complicated. Now, for the first time in history, the drive for change is including environmental considerations along with technology, cost, and convenience. For many people, the alternative (c) offers lower emissions with convenience, and that is enough to justify the update. Of course, an even better environmental choice would be to go back to the manual lawn mower, as generating electricity might also be a source of emissions, as in the case of thermal power plants burning coal.
So, the next energy transition is about using renewable energy sources in order to reduce emissions and also to move away from fossil fuels that will eventually run out. According to the EIA (U.S. Energy Information Administration), ‘Renewable energy is energy from sources that are naturally replenishing but flow-limited; renewable resources are virtually inexhaustible in duration but limited in the amount of energy that is available per unit of time.’3 Solar and wind offer the best examples of this intermittency, as the amount of power that can be generated each day varies through seasons and can be predicted only up to a point.

Smil4 lists ‘nine major kinds of renewable energies: solar radiation; its six transformations as running water (hydro energy), wind, wind-generated ocean waves, ocean currents, thermal differences between the ocean’s surface and deep waters, and photosynthesis (primary production); geothermal energy and tidal energy.’ Being renewable does not mean lack of emissions. Burning wood (generated by photosynthesis) is a source of emissions after all. Also, being a low-emissions source of energy does not mean it is renewable, as in the case of nuclear power stations; they use uranium as fuel, which has limited recoverable resources in the same way as oil.
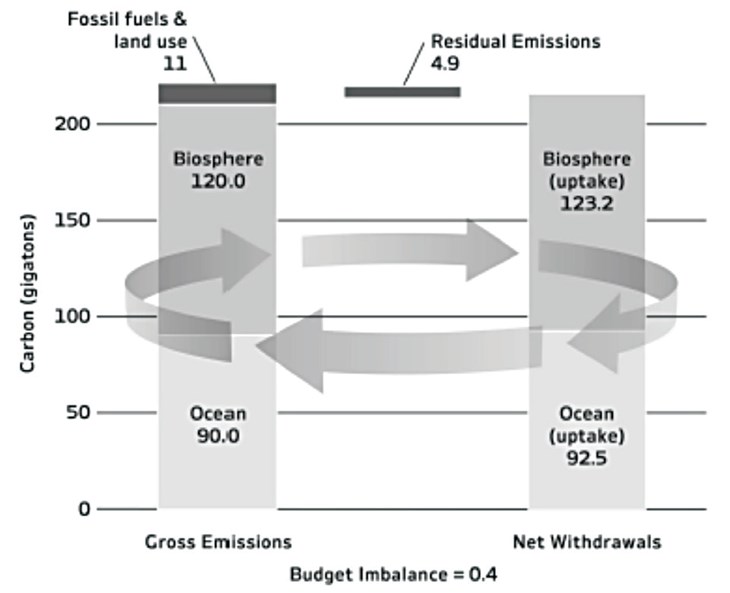
Why are emissions a problem? Yergin5 offers a concise explanation. ‘Here is how the logic works, using average annual data from the years 2009–2018 (see Figure 2): Some 210 gigatons of carbon were annually, on average, naturally released by such processes as the decay of plants and breathing by people and animals. But 9.5 gigatons came from fossil fuels and 1.5 from land use. This added up to a total of 221 gigatons released. But only 215.7 were captured in the natural annual cycle—that is, absorbed by vegetation and the ocean—leaving a residual 4.9 gigatons in the atmosphere uncaptured. (There is also a budget imbalance factor.) That uncaptured 4.9 gigatons is only 2.2 percent of the naturally captured CO2. That may seem a very small amount in any given year. But, over the years, it accumulates and builds up in that band of gases known as earth’s atmosphere. Water vapor is the most prevalent greenhouse gas. Others include nitrous oxide and methane. Some of these gases dissipate after a year or ten years; others last much longer. Some are more potent than CO2.These greenhouse gases become a shield of sorts, a global “greenhouse” around the planet, retaining more of the sun’s heat, which otherwise would flow back into space. The result is greater warming for the earth—thus known as the ‘greenhouse effect.’
There is plenty of evidence that the planet is warming and that humans are contributing to it. However, relationships of cause and effect between this warming and climate are yet now well understood. A recent book6 for example, argues that many extreme weather events, such as tornados and droughts, have not seen any increase in frequency for the last 100 years, and so are not linked to global warming as many sources often try to report.
Even if the effects of climate change are disputed, some facts still stand. Emissions of hazard pollutants caused – and still cause – health problems in many places, including the United States.7 It is worth noticing that concerns over air pollution can be directed linked to the enactment of many pieces of American legislation – chiefly among them the Clean Air Act – and the creation of the Environmental Protection Agency (EPA), that is today responsible for setting emission’s limits and enforcing these limits.

Timeframe and Challenges for the Next Energy Transition
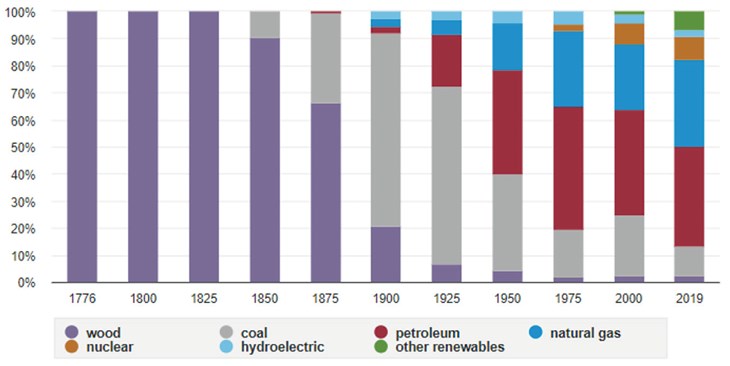
As we have seen, energy transitions are nothing new; and one thing that history has taught us so far is that they take a long time to happen. Smil8 studied major transitions for five Countries (U.S., China, Japan, Russia, U.K., France) for a period of 150 years. Tracking consumption from wood to coal and onward, he measured how long it takes for an energy source to go from a 5% to 25% share of total energy supply.8 ‘The repeated answer is that it takes decades of gradual penetration. After crude oil claimed 5% of the total American energy supply in 1905, it took 28 years to reach 25%, and the rise was even slower for natural gas, 33 years from 1924 to 1957. Today, despite the attention lavished on solar cells and wind, those up-and-coming renewables have yet to reach even the 5% mark.’8 Figure 2 illustrate this point with data collected by the EIA (U.S. Energy Information Administration).
So, although the shift to renewables is desirable – and eventually inevitable – ‘neither its pace nor its compositional and operational details are yet clear.’4 Despite our modern understanding of science, advanced manufacturing technology, abundance of materials, and environmental concerns, there is no indication that the forthcoming shift will be any different from the previous ones from a time perspective. There are several challenges that hinder the pace of transformation and in the following paragraphs we are going to explore two of them: density and infrastructure.
Renewables have not only lower energy density but also lower power density. Energy density refers to the quantity of energy contained per unit of mass or volume. The more concentrated the energy is – that is, the denser – the less fuel you need for a given application. A direct consequence of this is, for example, the extreme difficulty in finding an alternative fuel for jet engines in planes, as any alternative for aviation kerosene needs higher or similar energy density. Some biofuels have been tested, but concerns over the impact on land requirements and food production are often cited as an impediment to large scale supply. And that leads us to our next definition: power density.

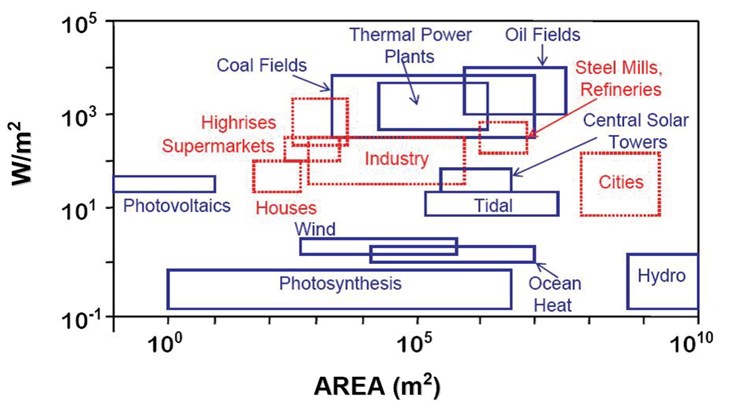
Another important density measure is power density, which is the rate of flow of energy per unit of land area. Now, we are interested in knowing how much land it takes to produce (or consume) a certain amount of energy. Today, a relatively small amount of land is used to produce the majority of the energy the world consumes. Smil4 calculated that land requirements for fossil fuels extraction, processing, and transportation, along with land for generation and transmission of thermal electricity, take no more than 30,000 km2. This is a land surface area equivalent to Belgium’s. On the other hand, using phytomass (plant biomass) would require ‘12,500,000 km2, roughly an equivalent of the entire territories of the United States and India, an area more than 400 times larger than the space taken up by all of modern energy’s infrastructures.’4
Figure 3 helps explain this concept, showing Power density versus area of different energy sites (production and consumption). So, the higher power densities mean less land requirements. However, there is also a matter of infrastructure. Today’s energy-hungry end users are being served by a vast array of ‘Coal and uranium mines, oil and gas fields, coal trains, pipelines, coal carrying vessels, oil and LNG tankers, coal treatment plants, refineries, LNG terminals, uranium processing (and reprocessing) facilities, thermal and hydro electricity-generating plants, HV transmission lines and distribution lines, and gasoline and diesel filling stations constitute the world’s most extensive, and the most costly, web of infrastructures that now spans the globe.’4
A similar infrastructure needs to be built to renewables, whatever they are. The best sites in terms of incidence and availability for wind and solar, for example, probably will be distant from the end users. High-density cities, for example, will not probably have large areas of available land in their vicinity. In order to connect them, new infrastructure for storage and transmission is needed. In other words, we are talking about a shift in distributing energy from a relatively small number of high power density sites to a world with a great number of energy-generating sites, using different, low power densities technologies, each contributing to a small amount of the total energy supply.

Conclusion
Despite ambitious goals proclaimed by politicians, the world in 2030 (or even 2050) tends to be similar to what we are experiencing now. Lower carbon? For sure, with more efficient prime movers and a larger share of renewable sources. With hope, also some decrease in the per capita use of energy.
So, back to the questions that initiated this article. What valves will be needed when we shift our fossil-fuel dependency to renewable sources? Also, when will this post-oil world require these valves? Given the challenges in technology and infrastructure we explored in this article, it is safe to say that renewables are still not requiring major changes in valve design. And that scenario will likely persist for the foreseeable future.
REFERENCES
1. https://www.brighthubengineering.com/machinedesign/74192-what-is-a-prime-mover/
2. https://en.wikipedia.org/wiki/Biomass_(ecology)
3. https://www.eia.gov/energyexplained/renewablesources/
4. Smil, Vaclav. Energy Transitions: History, Requirements, Prospects; Praeger, 2010.
5. Yergin, Daniel. The New Map: Energy, Climate, and the Clash of Nations; Penguin Press, 2020.
6. Koonin, Steven E. Unsettled: What Climate Science Tells Us, What It Doesn’t, and Why It Matters,
BenBella Books, 2021.
7. https://www.forbes.com/sites/niallmccarthy/2021/04/22/the-most-polluted-cities-inamerica-infographic/?sh=60a322986fae
8. https://www.politico.com/agenda/story/2015/05/energy-visionary-vaclav-smil-quick-transformationswrong-000017/
ABOUT THE AUTHOR
Davi Correia is a Senior Mechanical Engineer who has worked at a major Brazil-based oil company for the last 15 years. Correia is part of multi-disciplinary team that provides technical support for topside piping and equipment of production platforms. During this period, he began to work with materials and corrosion, and later moved to piping and accessories technology, where he has become one of the lead technical advisors on valve issues. Correia was part of the task force that revised the IOGP S-562 standard, and wrote the S-611 standard. Correia has a master’s and a doctor’s degree in welding by the Universidade Federal de Uberlandia.

